State of the State Part II
The original post was written last December (almost 10 months ago). To summarize, I mentioned my time series logging program, Adversaria, and I wrote about my little toy key-value store, Fickle. I wrote that I would try to add transactions, and then I ended with a goal to use it to power this blog.
Since then, I wrote a skip list in C, implemented basic transactions in Go, and played around with chunks of ordered byte slices, and wrote a memory-mapped linked list.
There was certainly a lack of focus, and part of that was due to the fact that I wasn’t exactly solving a problem. All of that work was mainly due to curiosity. This time, I do have a problem to solve, and it’s worth solving!
Cistern
I’m not exactly interested in writing a traditional database anymore. I’ve been working mainly on Cistern, my sFlow collector. sFlow is a network monitoring specification. It’s very simple to understand. A set of devices (routers, switches, servers) emit counters and packet samples, and they all flow to a collector. The collector then aggregates them.
This is how it all works as a short summary.
- Devices generate sFlow datagrams. I started to write a host sFlow daemon in Go. Since that isn’t finished, I’m using the original hsflowd. I also have Brocade switches that generate sFlow datagrams in hardware.
- Datagrams get decoded using my sFlow decoding package. This one works pretty well!
- Packet samples get decoded using my protocol decoding package. This is a rewrite of what I wrote a few months ago.
- Decoded headers get organized into “flows” and sent to my flowtrack package. This one is an MVP that needs to be rewritten.
- sFlow counter records are simply numbers, so they simply get aggregated in Cistern’s metric registry.
- Every N seconds, the state of all the metrics is recorded into a metricstore. A metricstore is essentially an organized set of linked lists, specifically listmaps.
- There’s a crude HTTP API to fetch all of the state (including the time series for metrics) as JSON.
Examples
This is something I came up with that uses Angular.JS and Cistern. The frontend polls occasionally to get a list of hosts, and then queries for the current values of certain metrics. It’s all completely dynamic. As new hosts start sending their sFlow datagrams, Cistern automatically creates new entries in the registry and starts supplying the frontend with an updated list of hosts.
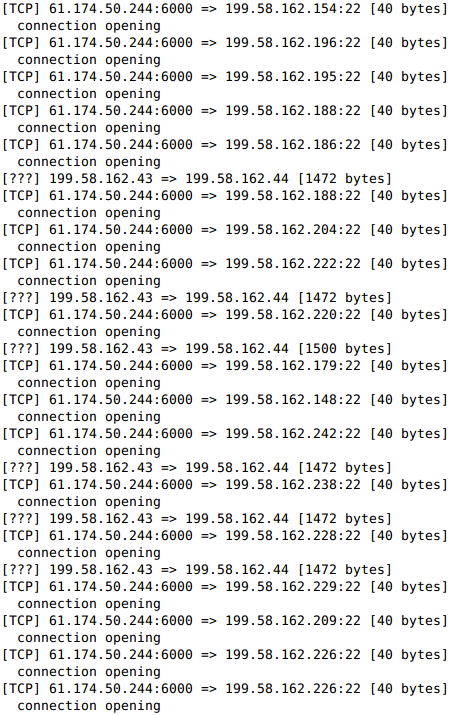
Here’s some information from packet headers. As you can tell, there’s a single IP address opening a bunch of connections to port 22 for a bunch of destination IP addresses. This is most likely a bot trying to find active hosts listening on port 22.
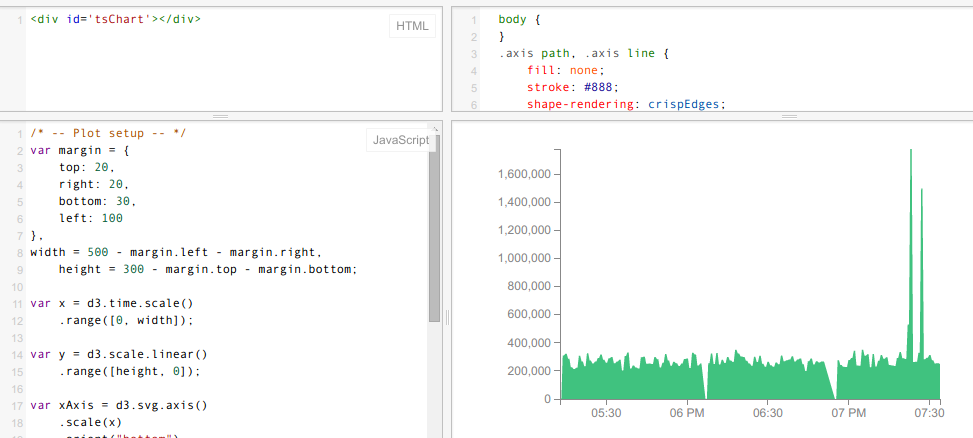
This is a quick demo using the HTTP interface to fetch time series for a metric. I used D3.js to plot the graph.
Does that sound like a lot? Well, it took me a while to get this far! Part of the reason is that I iterate a lot. Cistern is the composition of a bunch of stuff that I’ve written in short bursts. I started writing some flow tools in February, and wrote the first flow collector in June. You’ll notice that Cistern has a lot of code / ideas in common with those.
There’s still a lot of other work to do. I’m probably going to work on some D3.js and AngularJS stuff. I need to work on my JavaScript :). I will have to update the storage engine to partition by time so I can get rid of older data. It should be easy enough. I also need to work on detecting scanners, and I have a couple of ideas on how to do that which involves a simple analysis of flows.
It’s kind of cool that I was able to do all this stuff (from scratch!) in my free time. Gettin’ good at this. :)

Hi 👋. I’m a software engineer in the San Francisco Bay Area, and co-founder of FunnelStory.