How to think about performance
I’ve noticed lately that whenever there’s some sort of performance problem, people like to immediately look at configuration. I’m guilty of this too. Here’s an example from a few months ago. A user chatted into VividCortex support…
… we have been having a concurrency issue in the evenings. I was wondering if you might point to some of the graphs to use to try and figure out where the bottleneck is?
I didn’t respond to the user, but I added an internal note in our support system.
I would increase buffer pool size to begin with.
Ughhh… that makes me cringe.
(To be fair, I think that was an OK suggestion. I noticed that their buffer pool reads [pages read from disk] were reaching 7,000 / sec, which roughly translates to 7K IOPS, and they had plenty of spare memory to use.)
I don’t like my response because the question was about performance, but I was thinking more about configuration than performance.
Besides that, I’ve also seen cases where people encounter high MySQL replication delay and resort to configuration changes (e.g. increasing open table limits, disabling binary logging (!), changing the instance type, and so on) without really thinking about why a replica is too slow to keep up with a master. Experimenting with config options with semi-educated guesses can be time consuming, frustrating, and even dangerous if you make a mistake.
I’ve learned a lot about performance over the past four years but often times I think it can get really complicated and hard to remember. Recently, I realized (with help, of course) that performance boils down to two simple points:
- Slowness is about spending time on something.1
- Things spend time doing work or waiting.
Those two points are enough for a framework to ask great questions. For example:
- X is slow. It’s spending time on something. Is it doing work, or waiting? How can I tell if it’s doing work or waiting?
- If it is doing work too slowly, why? What does the USE Method tell me?
- If X’s resource Y is saturated, why is Y slow? Go to step #1 for Y.
- If it’s waiting, how can I tell what it’s waiting on?
and so on.
Following this framework may lead you to the cause of your performance problems, but it may not. I think at the very least it’ll guide you in the right direction step by step. This is a very important thing. I think it’s very easy to get lost in metrics and charts.
Example
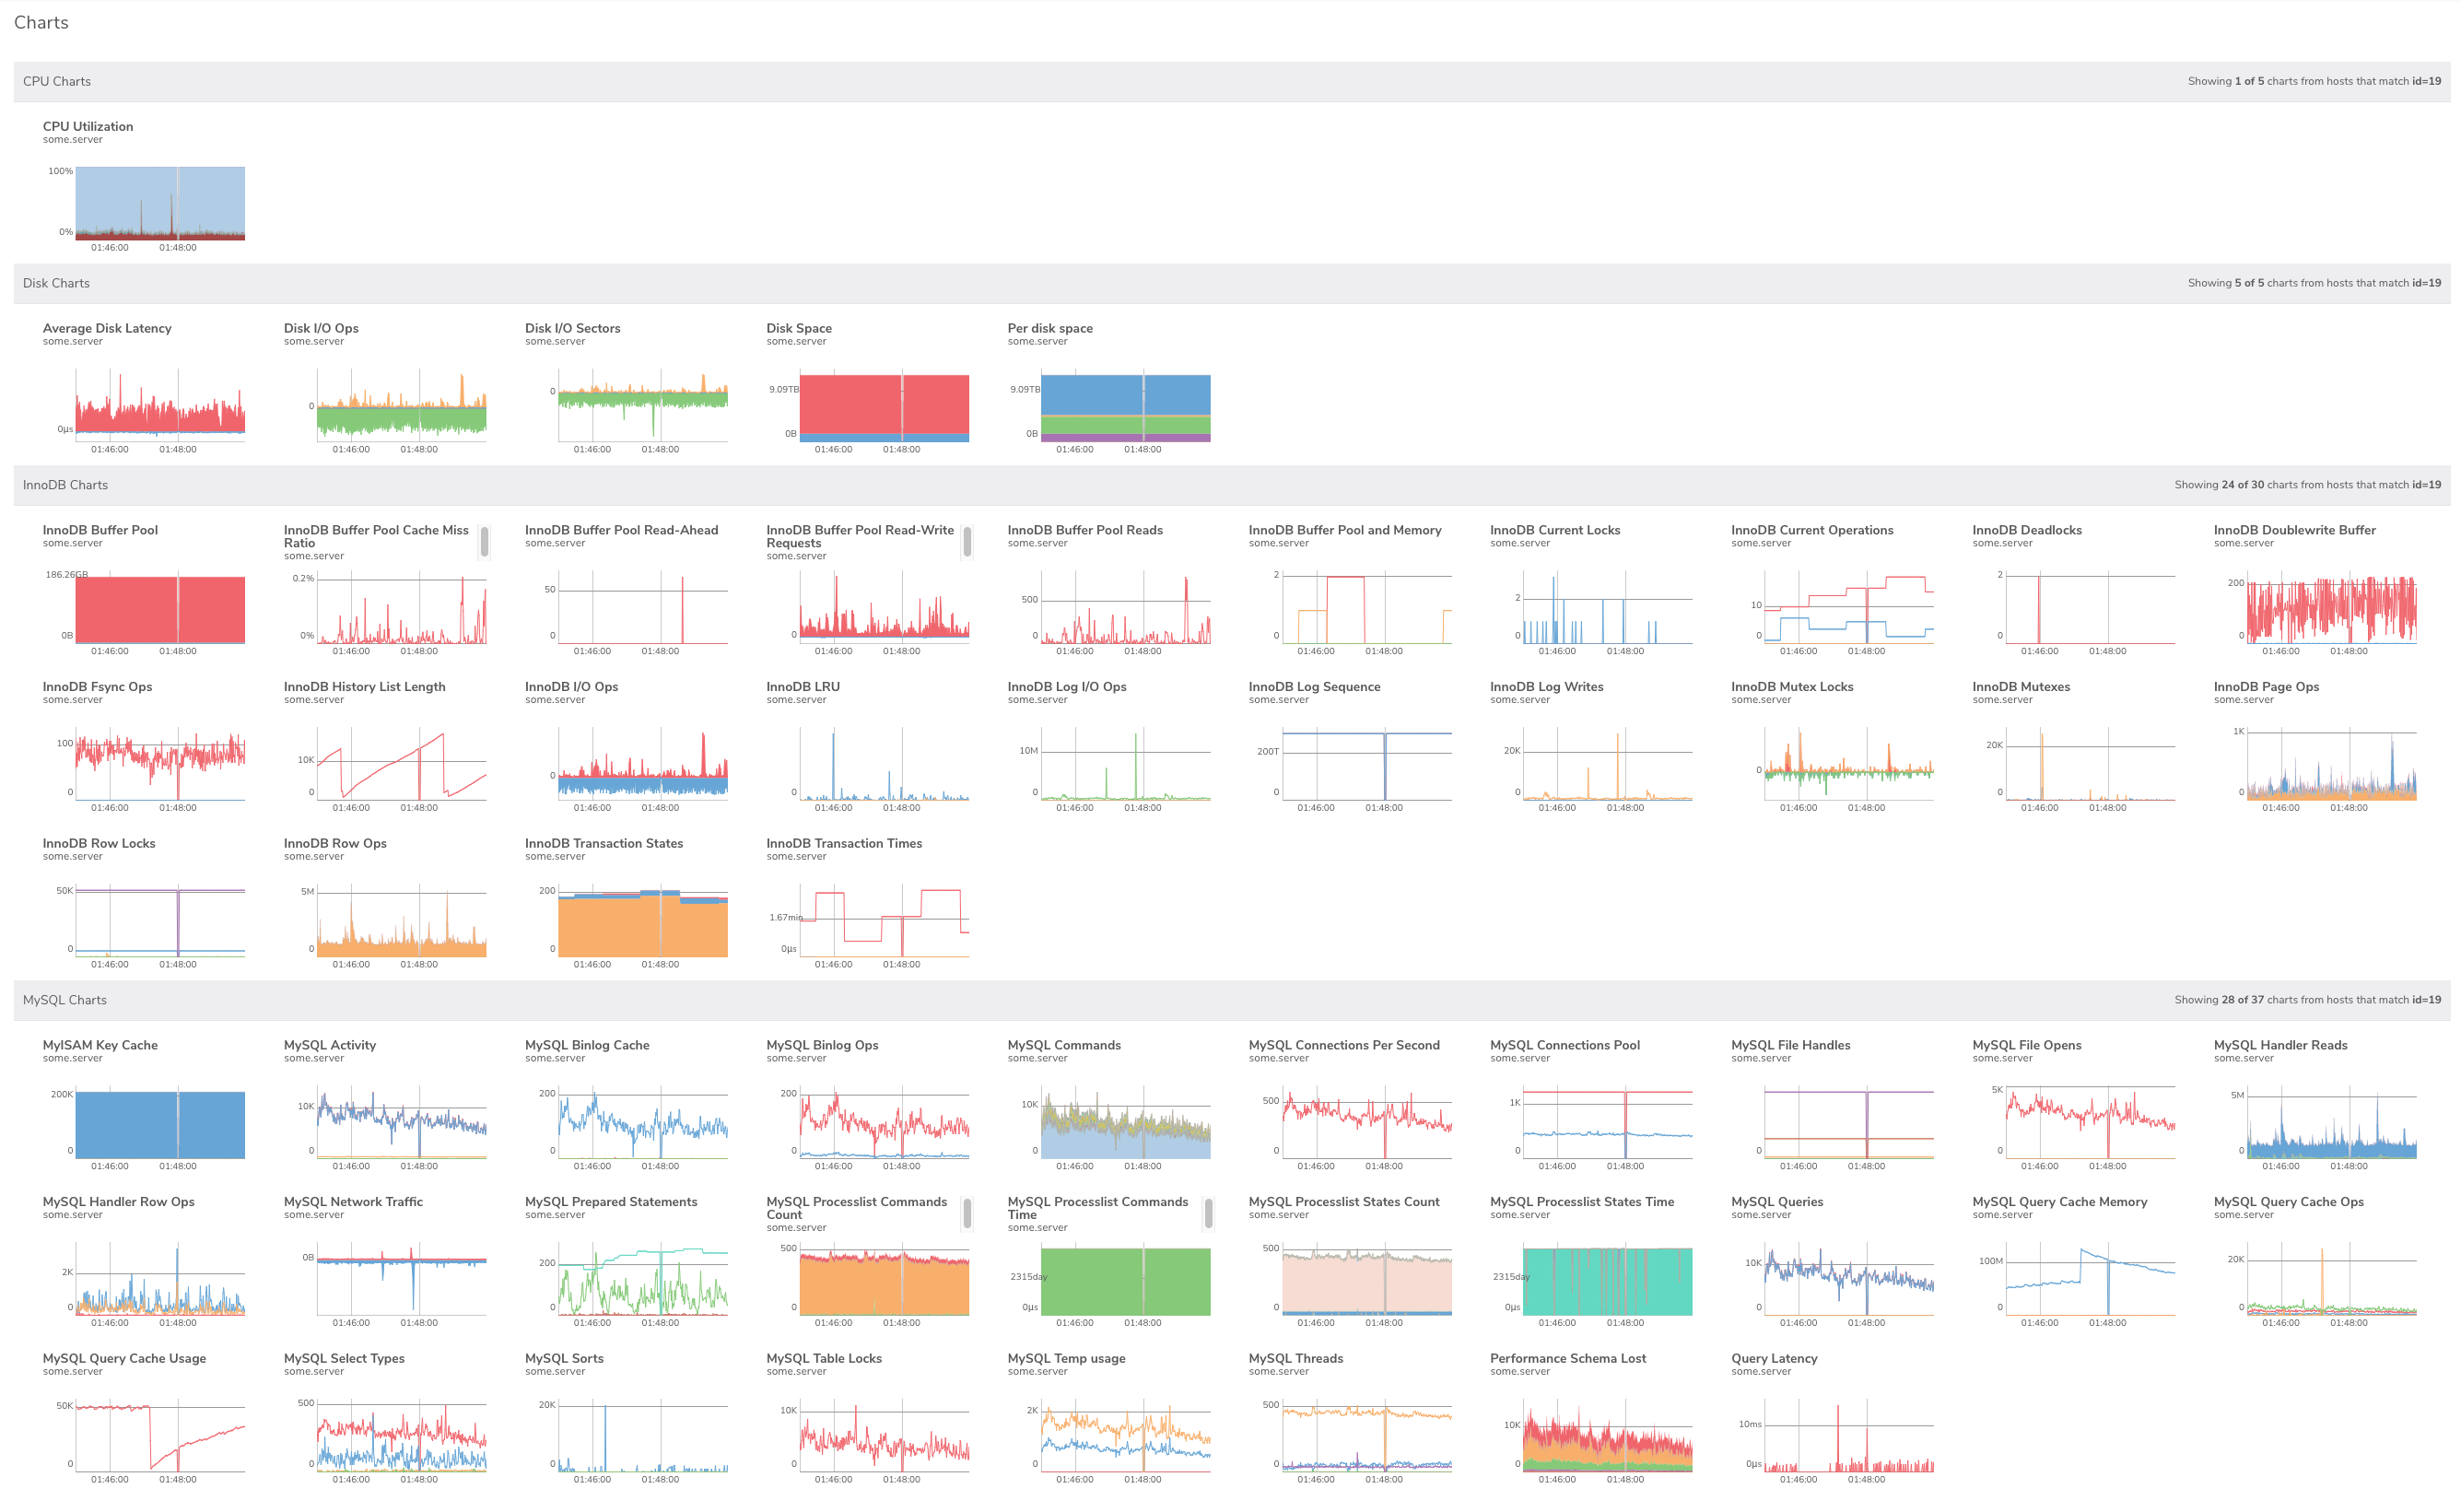
Take a look at the screenshot below. These are CPU, disk, InnoDB, and MySQL charts in VividCortex around the time a server stall (i.e. it got slow) was detected. All of the charts look interesting! Where would you start to diagnose this stall using this page? Without a framework, I’d probably just scan every chart.
Let’s look at how we can approach this problem by thinking about how things spend time. I know that during this stall, a bunch of threads piled up (MySQL concurrency) and the query throughput dropped to about half. Why was this server slow? It doesn’t seem to be getting work done.
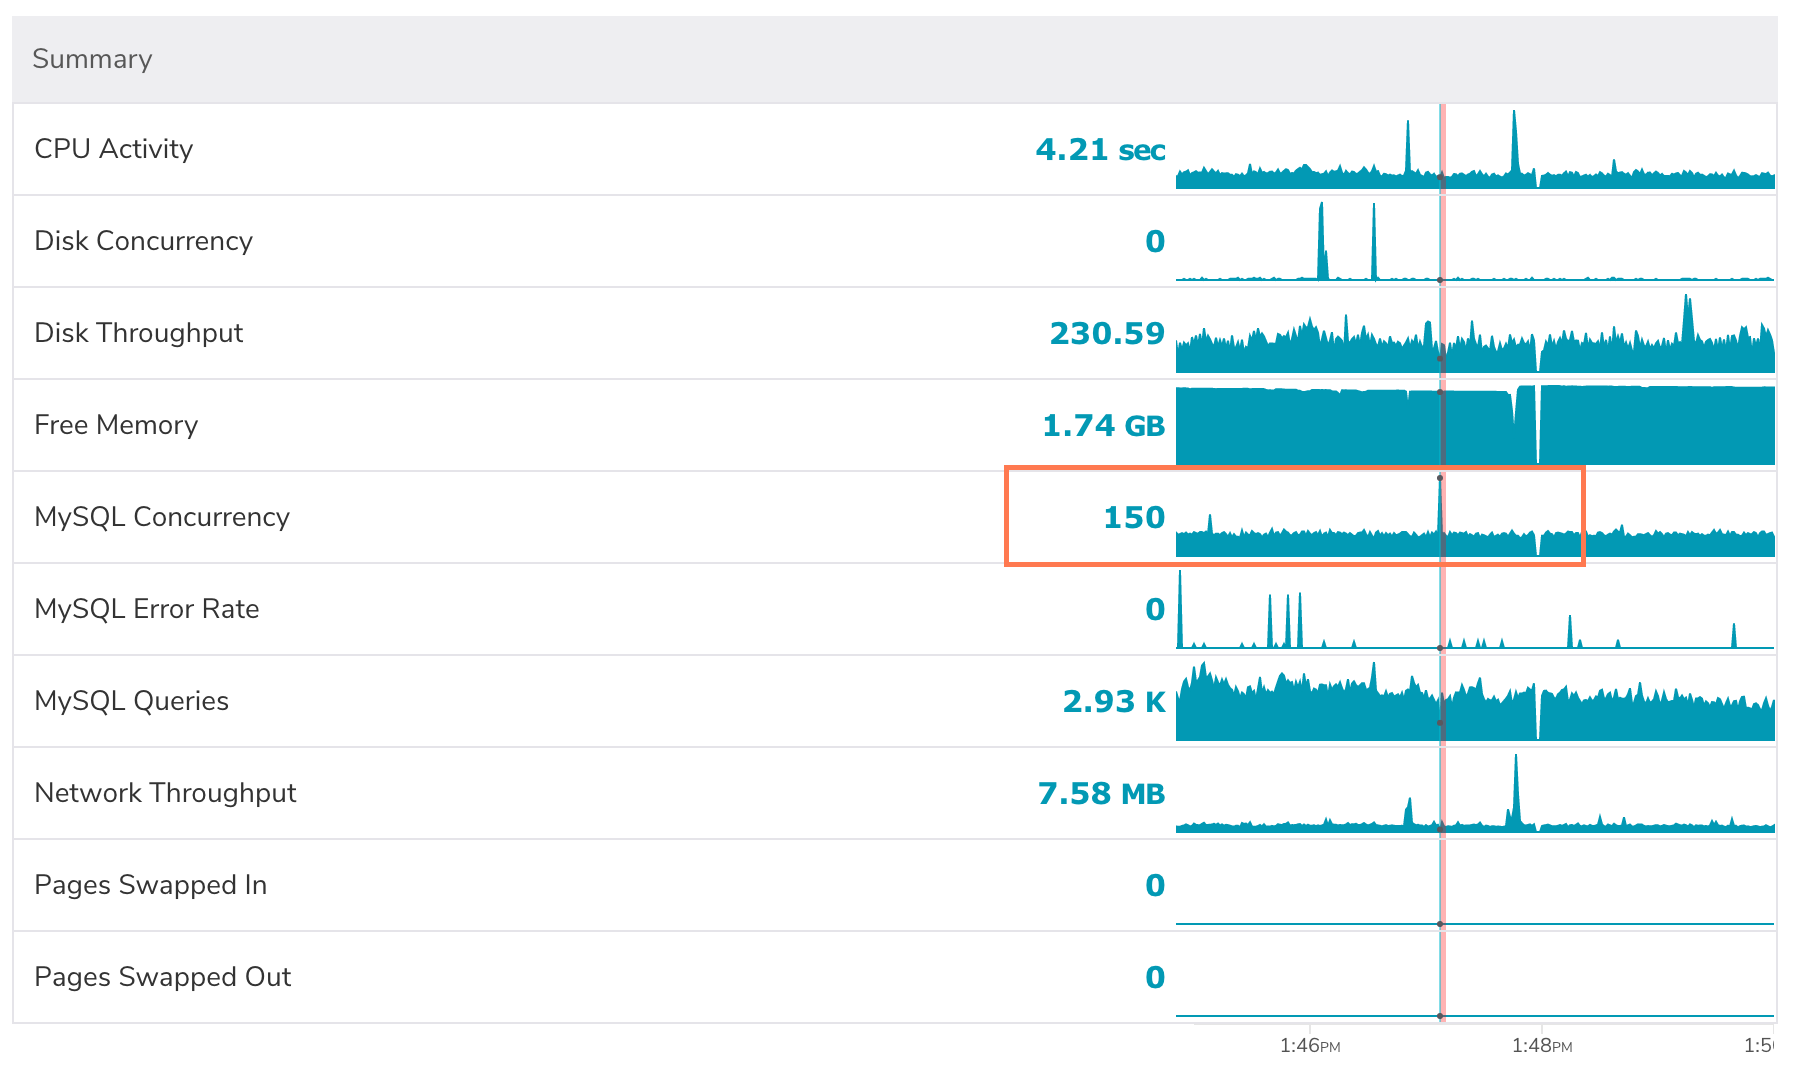
150 threads running… what are they doing? Are they doing work, or are they waiting for something? Let’s check out the thread states.
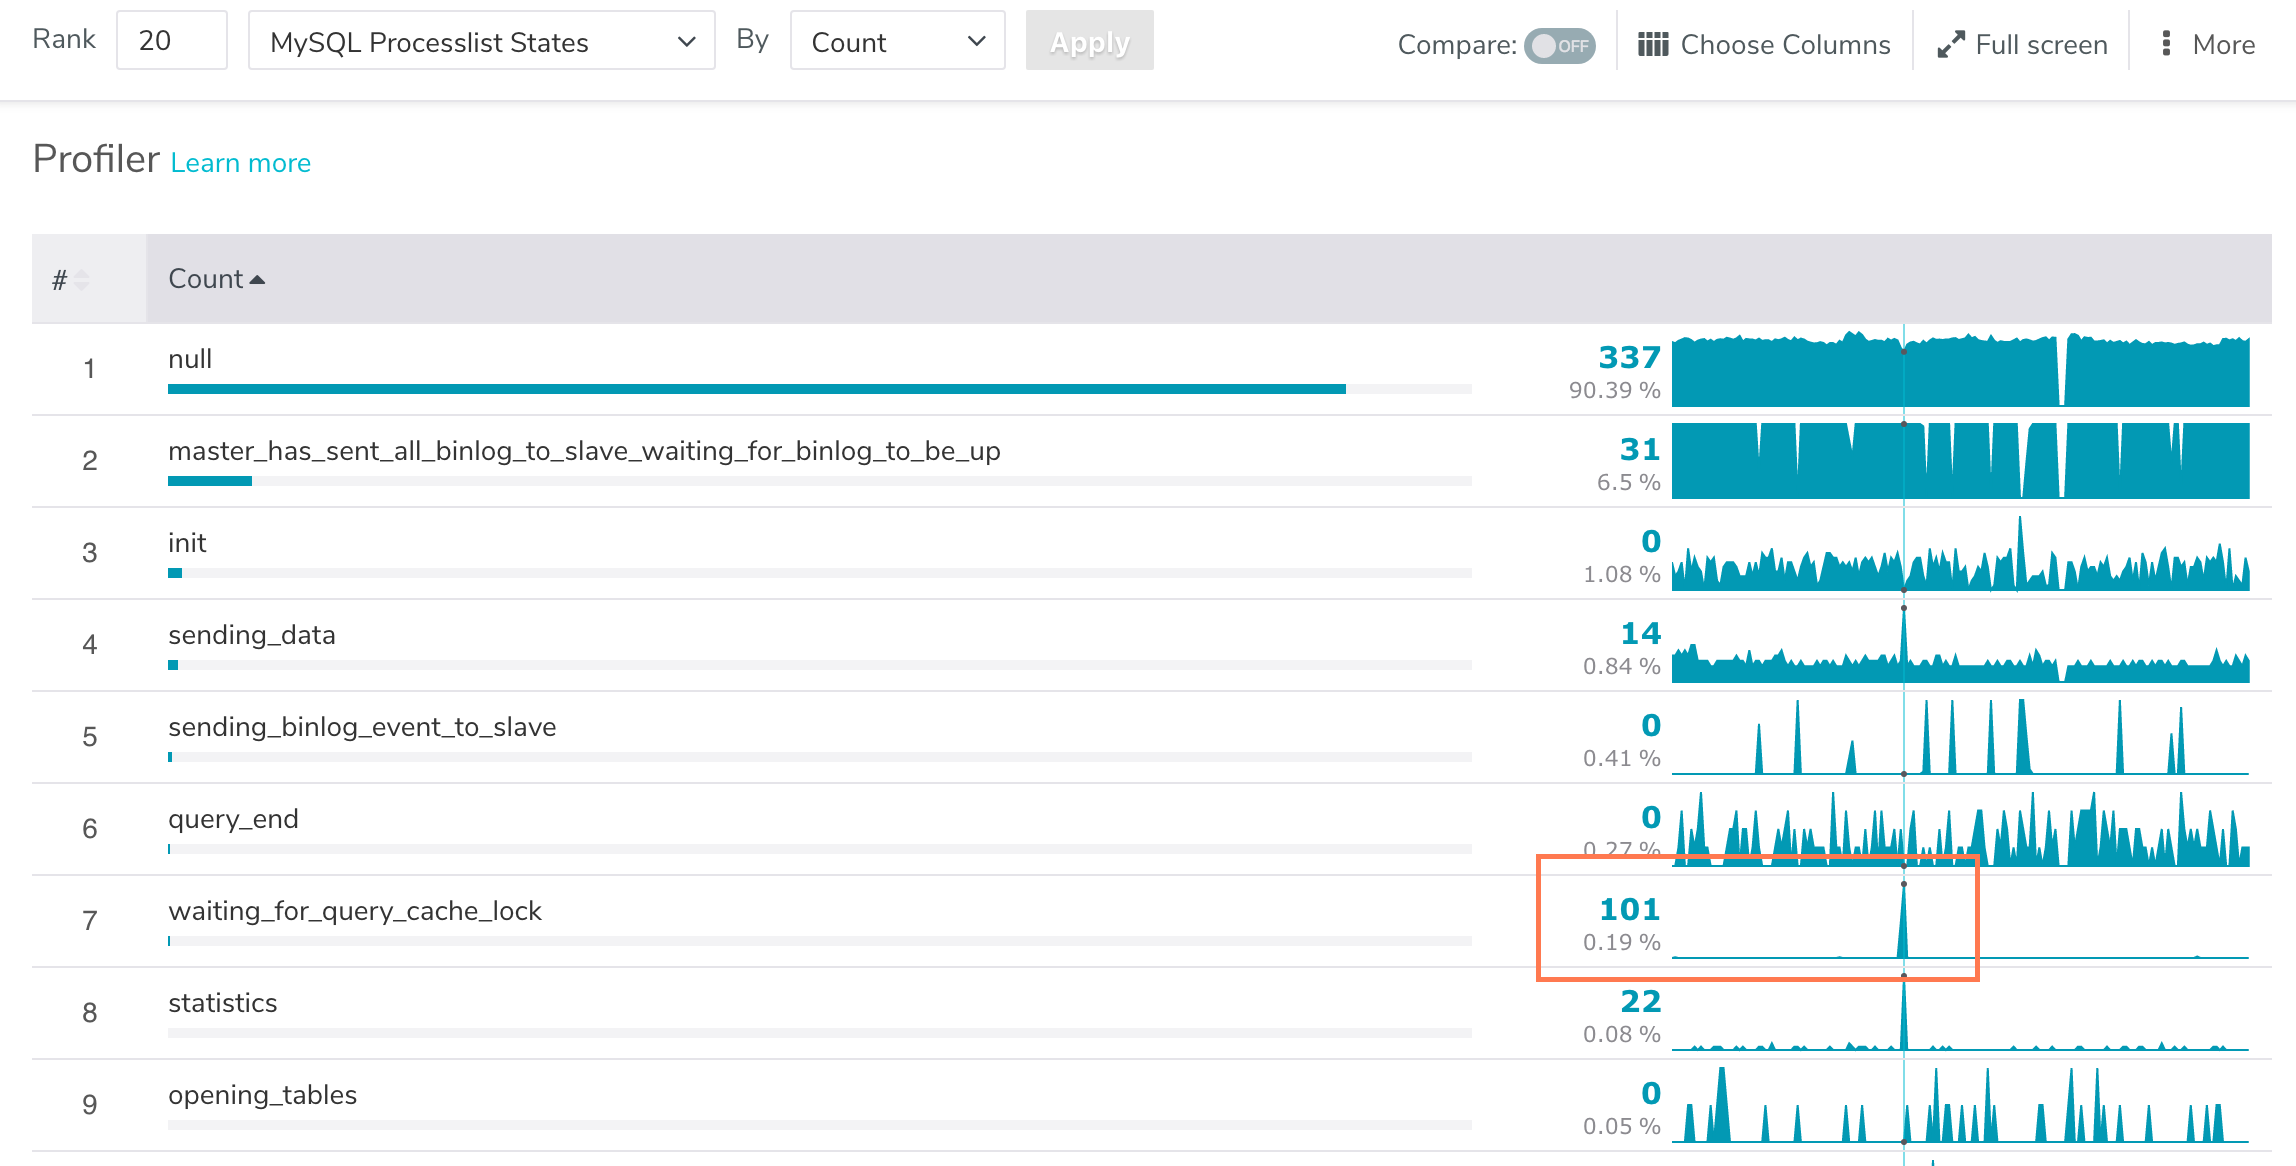
Ahah! 101 threads are waiting for a lock! Well, that was easy. The infamous query cache strikes again!
I think this process works well for performance problems at any level (system, database, application, etc). I think it also probably gives you an idea of how to instrument your services, or find out where your instrumentation is lacking.
- This one’s from Baron (@xaprb)