MySQL Explain Analyzer
tl;dr: The source is at github.com/Preetam/explain-analyzer and you can try it out here.
I read Performance Impacts of Data Volume a few weeks ago on “Use The Index, Luke!” and found the whole workflow really fascinating. Here’s the first paragraph on that page:
The amount of data stored in a database has a great impact on its performance. It is usually accepted that a query becomes slower with additional data in the database. But how great is the performance impact if the data volume doubles? And how can we improve this ratio? These are the key questions when discussing database scalability.
I was thinking about this and how query EXPLAINs from a test environment can help you
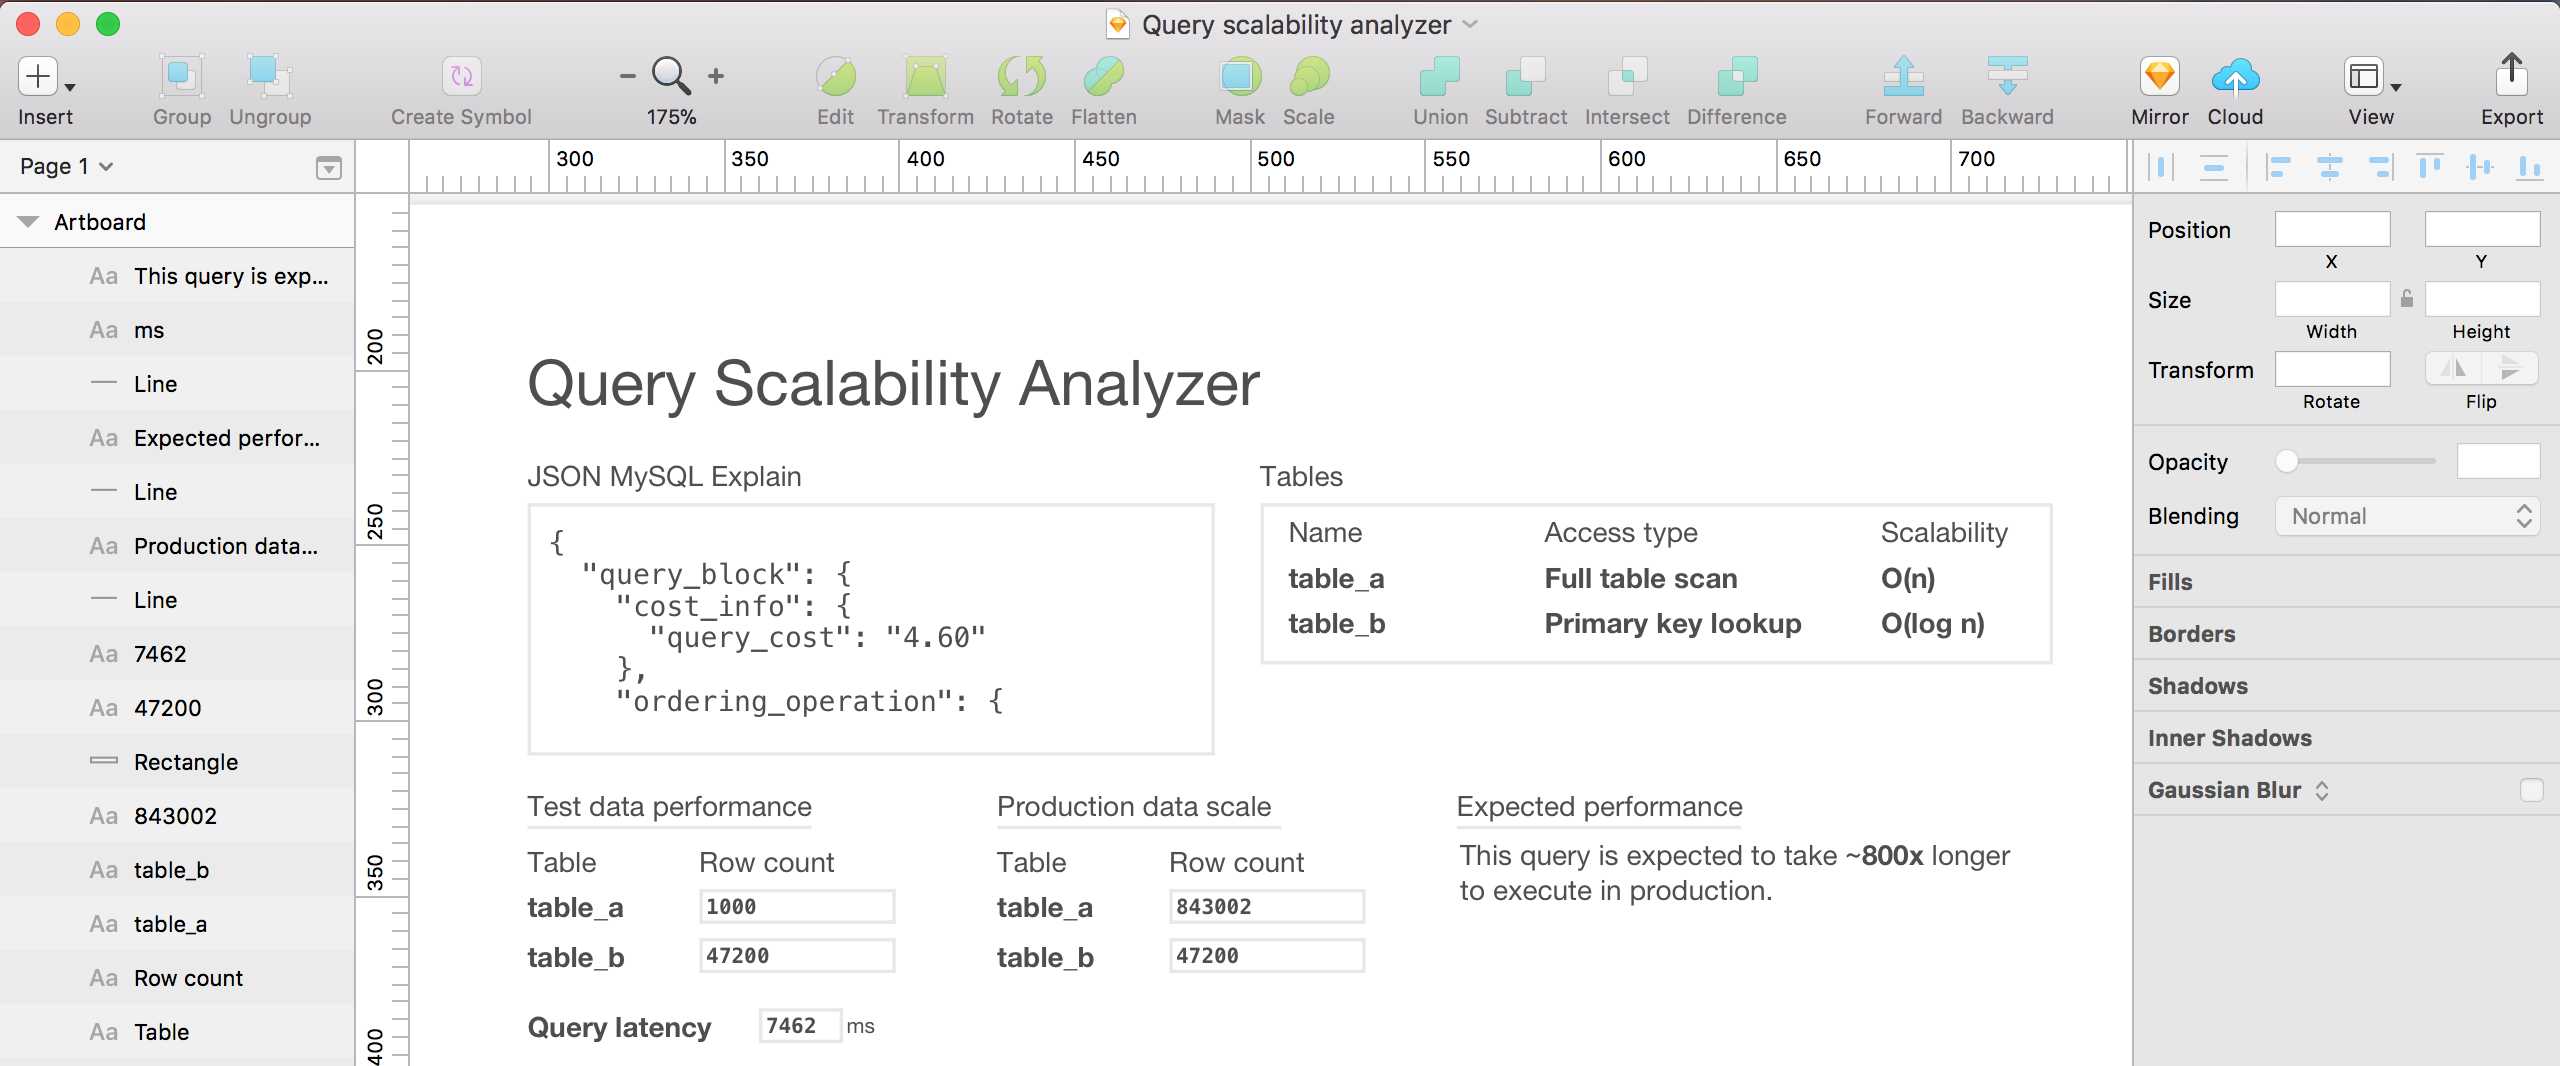
predict the performance in production. As a design exercise for myself, I first made a
really rough mockup in Sketch. I wanted something that would accept MySQL’s JSON explain output
(EXPLAIN format=json SELECT ...) and give me a few fields
to try out different row counts and do some napkin math about the expected performance.
Then I ended up taking a couple of evenings or so to actually build this thing. The source is at github.com/Preetam/explain-analyzer and you can try it out here. It’s my biggest public Mithril.js project so far!
Here’s an example! This is a query with a few joins. The “scalability” column is populated based on the access type. “ref” gets O(log n) because that means an index is being used, and B-tree lookups are O(log n). Again, napkin math. This isn’t supposed to be super complicated or accurate. For example, I know that the “ref” scalability is wrong because I’m using the rows read during the scan instead of the number of rows in the table for the calculation. It’s meant to be slightly better than doing stuff in your head.
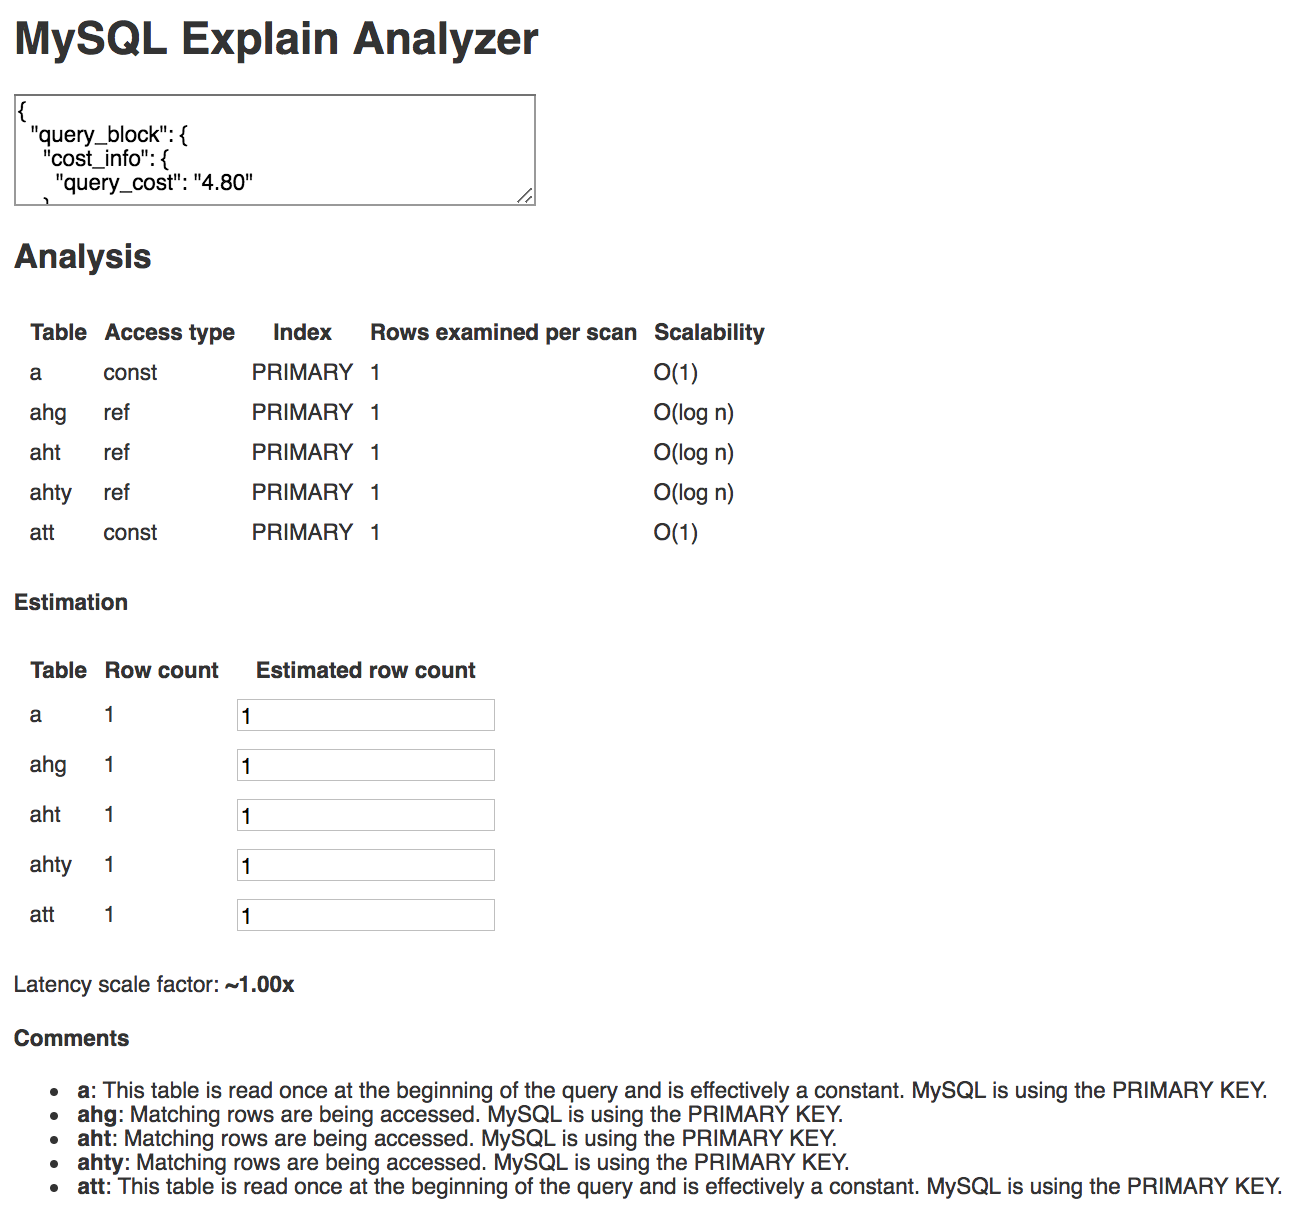
I can try out different values in the “estimated row count” column and the latency scale factor gets updated.
Here’s another example with a couple of full table scans and two full index scans. Better keep an eye on those tables with this query!
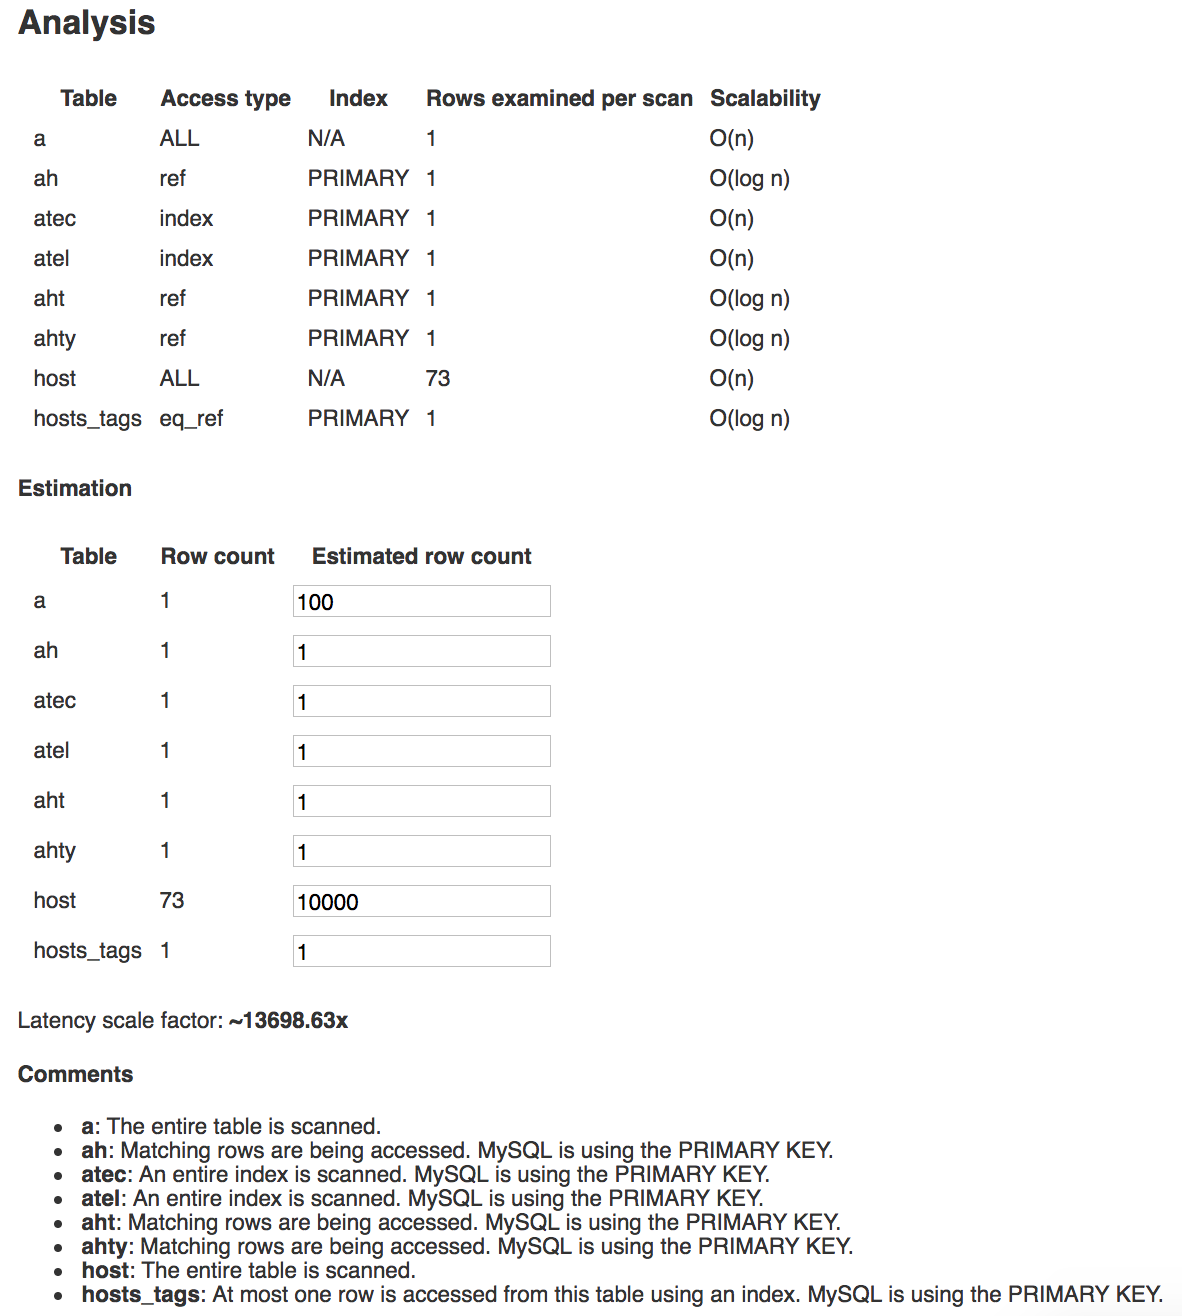
You may notice that there’s a “Comments” section that’s not in the mockup. That’s because I kept trying this analyzer out and had to keep the 8.8.2 EXPLAIN Output Format page of the MySQL Reference Manual open because I kept forgetting what all of the values for the columns meant. I was always looking at the explain table and thinking, “what is this telling me?” Now the “Comments” section just tells me what I’m looking at. Now I think that’s the most useful part of all this.
What’s next
It could look a lot better. The real thing isn’t as nice as the design, and the design is still pretty bad. I’ll work on that soon. In terms of the implementation, the explain analyzer is a single page app without any state, so if you refresh the page, you’ll lose everything. I think I’m going to add a “share” feature so that you can get a permalink with all of the values saved. That’ll take some more work but I think it would be a neat opportunity to use AWS Lambda for a user-facing site!