Terrace Storage Experiment Update
What is Terrace?
Terrace is my new storage format for events and time series that I think can change the way we think about cloud-native time series storage. I introduced it in an earlier post and mentioned how it will use automatic indexing to optimize data layout. This post is about how the experiment is going so far, and what the next steps are.
So far, things are looking good! Early last month I only had an idea and zero code. Now I have a basic generator, file format, and some success with simulated data. Read on to see how it works.
The code is available on GitHub: https://github.com/Preetam/terrace
Structure of Terrace files
A Terrace file is made up of many layers. Each layer represents one attribute or dimension in your events. A level is a chunk of data, and multiple levels make up a layer. Levels also have nesting, so each level can have multiple sublevels which form the rest of the layers. In the following diagram, there are three layers: region, server, and level (like log level, not a Terrace level. Naming is hard!). Each blue box is a Terrace level.
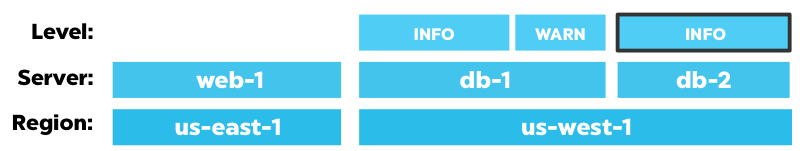
The us-west-1 level has two sublevels: db-1 and db-2.
An event in the top right highlighted sublevel would look like this:
{
  "timestamp": 1536218943,
  "region": "us-west-1",
  "server": "db-1",
  "level": "INFO",
  "query": "SELECT * FROM users",
  "latency": 0.48
}
Each level summarizes all of the events contained within it. At the moment summary information includes count and sums of all numeric attributes. Summary information for the us-west-1 level could look like this:
{
  "count": 274,
  "sums": {
    "latency": 38.6
  }
}
That’s saying that there are 274 total events within that level, and the
sum of all latency attributes for those events is 38.6. If we wanted
to get the average latency of all events with region: "us-west-1", we
can just access the summary information in the us-west-1 level. We don’t
have to scan all of the events and aggregate the latencies. This is super
helpful for analytics queries.
Now that you know about the structure of Terrace files, let’s look at how they’re generated.
Generation
The Terrace generator takes two inputs:
- Events file
- Constraints file
The events file has JSON events, 1 per line. The constraints file is the set of constraints to optimize against. You can think of the constraints as a set of WHERE clause filters. Using those two inputs, the Terrance generator will iterate through different permutations of level structures and optimize against the given constraints.
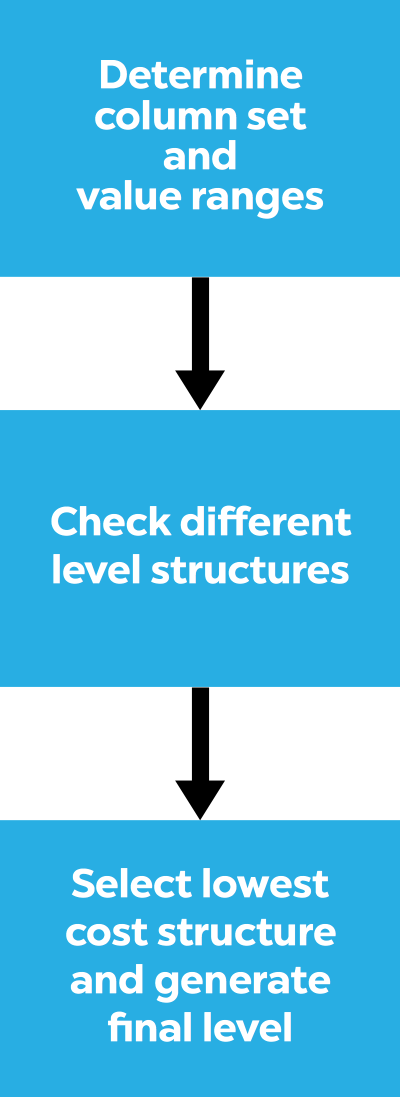
Yes, I wrote permutations in the previous paragraph. The generator uses Heap’s algorithm to consider permutations of possible attribute/column orderings. To actually try out all permutations is explosively expensive! So we don’t. High cardinality columns are excluded, so things like counters and timestamps are automatically taken care of. Among the remaining columns, the ones which aren’t constrained are also not considered for level generation. And finally, after all that, I just sample from the remaining permutations. At the moment this seems to be enough to get generation to finish in a reasonable amount of time.
Something else that happens during the initial pass (when column cardinality is checked) is that ranges for the remaining columns are determined to figure out split points for levels. This is because a level can represent a range of values for a column.
Cost calculation
For each level we try, we need a way of figuring out how good it is. To do that, I created a really simple cost calculation function that tries to find all of the events that match the constraints. I have separate costs for accessing a level and accessing an event. The cost of an event access is higher than a level access because I’m treating them as big scans, and I want to minimize those.
Trimming
One of the final optimization passes is called trimming, which flattens levels to avoid unnecessary nesting and duplication. Here’s a simple example to show you what I mean. Passing in
{"datacenter": "us-east-1"}
{"datacenter": "us-east-1"}
{"datacenter": "us-east-1"}
{"datacenter": "us-east-1"}
{"datacenter": "us-east-1"}
{"datacenter": "us-east-1"}
{"datacenter": "us-east-1"}
{"datacenter": "us-east-1"}
as the input will result in the following Terrace structure:
{
  "count": 8,
  "fixed": {
    "datacenter": "us-east-1"
  }
}
Cool, right? We get deduplication automagically.
Testing, and the Time Series Benchmarking Suite (TSBS)
To do some serious testing, I wanted simulated data. Fortunately the folks at TimescaleDB created a set of tools that form a framework to test out time series storage solutions. It’s adapted from an earlier work published by InfluxData. You can read more about it here. That saved me a bunch of time!
I made a fork of this project to print generated time series events as JSON. I used these JSON events to work on the Terrace generator.
Here’s what the generator output looks like with test data simulated with
$ tsbs_generate_data -format json -use-case devops -log-interval 6h -scale-var 100
Generation: Considering column set: [os service_environment service_version rack region arch hostname datacenter service team]
Generation: 3628800 total possible orderings
Generation: Using column ranges {"arch":[{"min":"x64","max":"x64"},{"min":"x86","max":"x86"}],"datacenter":[{"min":"ap-northeast-1a","max":"ap-northeast-1a"},{"min":"ap-northeast-1c","max":"ap-northeast-1c"},{"min":"ap-southeast-1a","max":"ap-southeast-1a"},{"min":"ap-southeast-1b","max":"ap-southeast-1b"},{"min":"ap-southeast-2a","max":"ap-southeast-2a"},{"min":"ap-southeast-2b","max":"ap-southeast-2b"},{"min":"eu-central-1a","max":"eu-central-1a"},{"min":"eu-central-1b","max":"eu-central-1b"},{"min":"eu-west-1a","max":"eu-west-1a"},{"min":"eu-west-1b","max":"eu-west-1b"},{"min":"eu-west-1c","max":"eu-west-1c"},{"min":"sa-east-1a","max":"sa-east-1a"},{"min":"sa-east-1b","max":"sa-east-1b"},{"min":"sa-east-1c","max":"sa-east-1c"},{"min":"us-east-1a","max":"us-east-1a"},{"min":"us-east-1b","max":"us-west-2c"}],"hostname":[{"min":"host_0","max":"host_13"},{"min":"host_14","max":"host_19"},{"min":"host_2","max":"host_24"},{"min":"host_25","max":"host_3"},{"min":"host_30","max":"host_35"},{"min":"host_36","max":"host_40"},{"min":"host_41","max":"host_46"},{"min":"host_47","max":"host_51"},{"min":"host_52","max":"host_57"},{"min":"host_58","max":"host_62"},{"min":"host_63","max":"host_68"},{"min":"host_69","max":"host_73"},{"min":"host_74","max":"host_79"},{"min":"host_8","max":"host_84"},{"min":"host_85","max":"host_9"},{"min":"host_90","max":"host_99"}],"os":[{"min":"Ubuntu15.10","max":"Ubuntu15.10"},{"min":"Ubuntu16.04LTS","max":"Ubuntu16.04LTS"},{"min":"Ubuntu16.10","max":"Ubuntu16.10"}],"rack":[{"min":"0","max":"11"},{"min":"13","max":"16"},{"min":"17","max":"2"},{"min":"20","max":"22"},{"min":"23","max":"26"},{"min":"27","max":"3"},{"min":"36","max":"38"},{"min":"4","max":"41"},{"min":"42","max":"45"},{"min":"46","max":"49"},{"min":"5","max":"53"},{"min":"57","max":"6"},{"min":"61","max":"63"},{"min":"65","max":"70"},{"min":"72","max":"74"},{"min":"75","max":"99"}],"region":[{"min":"ap-northeast-1","max":"ap-northeast-1"},{"min":"ap-southeast-1","max":"ap-southeast-1"},{"min":"ap-southeast-2","max":"ap-southeast-2"},{"min":"eu-central-1","max":"eu-central-1"},{"min":"eu-west-1","max":"eu-west-1"},{"min":"sa-east-1","max":"sa-east-1"},{"min":"us-east-1","max":"us-east-1"},{"min":"us-west-1","max":"us-west-1"},{"min":"us-west-2","max":"us-west-2"}],"service":[{"min":"0","max":"0"},{"min":"1","max":"1"},{"min":"10","max":"10"},{"min":"11","max":"11"},{"min":"12","max":"12"},{"min":"13","max":"13"},{"min":"14","max":"14"},{"min":"15","max":"15"},{"min":"16","max":"16"},{"min":"17","max":"17"},{"min":"18","max":"18"},{"min":"19","max":"19"},{"min":"2","max":"2"},{"min":"3","max":"3"},{"min":"4","max":"4"},{"min":"5","max":"9"}],"service_environment":[{"min":"production","max":"production"},{"min":"staging","max":"staging"},{"min":"test","max":"test"}],"service_version":[{"min":"0","max":"0"},{"min":"1","max":"1"}],"team":[{"min":"CHI","max":"CHI"},{"min":"LON","max":"LON"},{"min":"NYC","max":"NYC"},{"min":"SF","max":"SF"}]}
Generation: Cost 462470 for column order [datacenter]
Generation: Cost 454880 for column order [datacenter os]
Generation: Cost 446680 for column order [datacenter os service_version]
Generation: Cost 457440 for column order [datacenter os service_version rack]
Generation: Cost 480470 for column order [rack]
Generation: Cost 479630 for column order [rack os]
Generation: Cost 447640 for column order [datacenter rack]
Generation: Cost 444940 for column order [rack datacenter]
Generation: Cost 459790 for column order [rack datacenter region]
Generation: Cost 502990 for column order [rack hostname]
Generation: Cost 469240 for column order [rack datacenter service_environment]
Generation: Cost 466700 for column order [rack region]
Generation: Cost 462490 for column order [datacenter service]
Generation: Cost 469850 for column order [datacenter region]
Generation: Cost 470590 for column order [rack service]
Generation: Cost 476030 for column order [rack service_environment]
Generation: Cost 473250 for column order [datacenter os service_version rack service]
Generation: Cost 443180 for column order [datacenter service_environment]
Generation: Cost 468730 for column order [datacenter service_environment service_version]
< ... more lines here ... >
Generation: Best column order with cost 415640: [datacenter rack service arch]
Generation: Generating final level
Generation: Trimming
Here’s a tiny portion of the Terrace file. Notice how the best column order was
determined to be [datacenter rack service arch], but there are only two layers
in the output, [datacenter rack], at least in this portion. That’s because for
racks “0” to “11” in ap-northeast-1a, the “arch” and “service” attributes are the
same for all events.
{
    "count": 4500,
    "sublevel_column": "datacenter",
    "sublevels": [
        {
            "column": "datacenter",
            "count": 360,
            "range": {
                "max": "ap-northeast-1a",
                "min": "ap-northeast-1a"
            },
            "sublevel_column": "rack",
            "sublevels": [
                {
                    "column": "rack",
                    "count": 45,
                    "fixed": {
                        "arch": "x86",
                        "service": "4"
                    },
                    "range": {
                        "max": "11",
                        "min": "0"
                    }
                }
            ]
        }
    ]
}
Next steps
Now that I have a basic generator, I can start iterating on the actual file format. This is meant for cloud-native storage so my target is an object store like S3 and I will be working within those constraints. I also have ideas to improve detection for correlated attributes, support for more summary information (like histograms), and better cost calculation. Lots of stuff to do!