State of the State Part III
First, I suggest reading Baron’s “Time-Series Database Requirements” blog post to get some more context for this post. I read that and, as I usually do, had my mind set on low-level thoughts. I wrote the following comment:

I took this screenshot a few months ago, so it has actually been almost a year since I wrote that. Time flies!
Cistern’s graphs
Cistern had graphs back in October 2014. I think I used my metricstore package. I’m not sure because I think I was switching storage engines every other week! I had both BoltDB and SQLite in the source code at some points in the past.
More progress! pic.twitter.com/UBG4gDBjvA
— Preetam Jinka (@PreetamJinka) October 14, 2014The issue was always getting graphs “right.” Every method I used seemed like a hack. And they were hacks. Nothing I used was specifically made for time series data. Bolt and SQLite are not very well suited for time series, and metricstore is as about as good as storing a CSV for each metric. I needed something better. After a couple of days of thinking and about three days of coding, I had something I named catena.
Catena
n. A closely linked series.
Catena is a time series storage engine written in Go. It started off very simple (as most things do). In the beginning, the most advanced data structure I used was an array. The implementation has changed since I started writing this post, but the overall design is the same.
I wrote Catena from scratch. I think it’s the best way to understand things completely. However, the ideas aren’t completely new. You can definitely see how some things were inspired by LevelDB and other log-structured merge systems. Unlike many of those storage engines, Catena is written specifically for time series. Time series data has very interesting characteristics, and the goal was to develop something that suits those characteristics well.
The fundamental unit in Catena is a point. A point is like a point on a time series line plot. Points are tuples with a timestamp and a value. A point belongs to a metric, which is something like mem.bytes_free. A metric has an arbitrary number of points. A metric belongs to a source, which is something like server.misfra.me. To reiterate, points belong to metrics, which belong to sources.
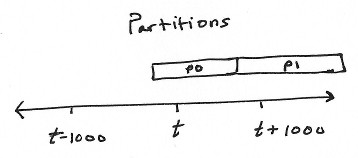
For various reasons, everything is separated into partitions. Partitions are chunks of time series data with disjoint timestamp ranges. Nothing is shared between partitions.

The most recent partitions are stored entirely in memory. Older partitions are compressed and stored as individual files on disk.
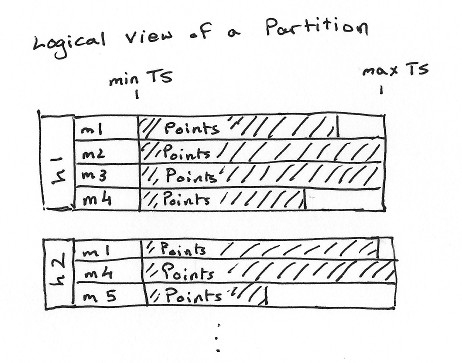
The following image shows how I view partitions. The in-memory partition structure looks a lot like this.

h1 and h2 are sources, and m1 to m5 are metrics.
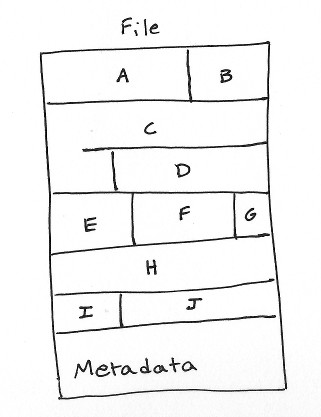
The on-disk partition format looks something like this:

A, B, ..., J are arrays of points. They are compressed using gzip compression.
The metadata at the end stores sources, metrics, and the offsets of the beginning of each point array. When a file partition is opened, its file is memory mapped and the metadata is read into memory in a structure very similar to an in-memory partition, excluding the points themselves. During queries, we look up the offset from the metadata structure, seek, and read the points off. With the current implementation, there is only one seek per metric. Concurrent reads are trivial with file partitions because they are read-only.
Although I did not know about it when I wrote Catena, Apache Parquet’s file format is very similar to what Catena uses. Validation!
That’s the basic overview of how things work. Stop here if you’re confused already. We’re going to dig deep into the internals next.
WAL
Any decent storage engine offers durability guarantees. A write-ahead log is a simple way of doing so. The API to insert data into Catena accepts rows, which have the following format:
[
  {
    "source": "my.source",
    "metric": "my.metric",
    "timestamp": 1234,
    "value": 0.5
  },
  {
    "source": "my.source",
    "metric": "my.metric",
    "timestamp": 1235,
    "value": 0.7
  },
  {
    "source": "another.source",
    "metric": "my.metric",
    "timestamp": 1234,
    "value": 2.12
  }
]
Each entry in the WAL is basically a serialization of a set of rows. It’s good to batch up a decent number of rows so you can do page-size writes to your filesystem. The serialization format is pretty simple. WAL entries are not compressed, but that should be an easy modification.
If something goes wrong during a write, the WAL gets truncated at the end of the last good record. This allows for easy recovery after a crash, but it does not protect against data corruption. If you have a bad record in the middle of your WAL, you would lose the rest of the data following that entry.
Memory partitions
The in-memory partitions are the only writable partitions. They exist completely in memory. Each memory partition gets a WAL. Writes first get appended to the WAL, and then make their way into the data structures in memory.
An interesting fact here is that writes do not have to be strictly in time order. Catena accepts a certain amount of “jitter” in the timestamps. Points get inserted in order once they are received. In order to support this, however, we need to keep more than one partition writable. If we receive points out of order, we may cross a partition boundary with one point, and then receive a point that belongs in the previous partition. This gives a generous amount of time to accept delayed writes. If your partition sizes are one hour, then you can potentially accept writes at least about an hour late.
Memory partitions are goroutine-safe. The current implementation uses lock-free lists for sources, metrics, and points.
File partitions
On-disk partitions are simple, and perhaps a little boring. They are read-only and are memory-mapped. Catena actually uses the PROT_READ flag only with mmap, so mapped pages are not writable (and attempts to write will trigger a segmentation fault). No locks are used with file partitions and one can have as many concurrent readers as possible.
Once there are too many in-memory partitions, the oldest gets “compacted.” Catena iterates through every source and every metric and flushes the points into a compressed gzip chunk and remembers the offset. Each points array is compressed separately. At the end, the metadata and associated offsets are appended to the file.
gzip compression is important. I chose gzip over something like Snappy because it uses entropy encoding. Entropy encoding is very good with patterns. This is great for time series data, especially if it is stored as packed arrays of (timestamp, value) tuples. Consider the following:
Timestamp | Value
--------- | -----
0x001234  | 0
0x011234  | 0
0x021234  | 0
0x031234  | 0
0x041234  | 0
Note that the timestamps are stored in little-endian format, so the values are increasing by one. The values are obviously all zeros. If you put the rows next to each other, side by side, you’ll notice that 1234 0 shows up often (every row has this, in fact). This pattern compresses quite well. Just for fun, I checked what the difference between little-endian timestamps and big-endian timestamps, and it turns out that big-endian timestamps are about 13.7% worse in terms of space.
Drawbacks
Catena isn’t very good with large partitions. If you have a metric with a million points in a partition, and you wanted to get the last point for that metric in that partition, you actually have to read every point because there is only one gzip stream. Splitting up points into smaller extents would be a good idea here. Realistically though, a million points per partition does not seem wise, but maybe it won’t be that bad when we get extents.
Catena also isn’t very good if you have lots of metrics with a single point. If you have a million metrics in a file partition, all of their metadata will be stored in memory. I don’t have a plan to address this issue right now, but I’m thinking along the lines of just keeping this stuff off memory and streaming it off disk when needed.
WAL recovery is also rather slow. It currently takes me about 20 minutes to recover from a 100 MB WAL on a 512 MB DigitalOcean droplet. I’m not entirely sure what the issue is, but since this is written in Go, I can get some CPU profiles and see where the hot spots are.
The current version (also the first) of Catena doesn’t have a good API for reading. It has this notion of a “query,” which is a lot like a “I want series X from t1 to t2, Y from t3 to t4, and Z from t1 to t4.” You send that to Catena and it gives you a struct with everything you asked for. This is great for a proof-of-concept, but it’s horrible in practice. Everything should really be in the form of iterators. I like the idea of an iterator next() call reading data off the disk and streaming it straight to a browser as fast as possible. This would not be too easy if everything had slices of points in memory protected by locks, but it’s much more realistic when you have linked lists with nodes you can “park” iterators on without causing concurrency trouble.
Final thoughts
Catena is on GitHub and is generously licensed with the BSD license.
This is the most technical post of the series! I hope I can keep this pattern going for future posts. Part I and part II of this series are also available if you’re interested.
